
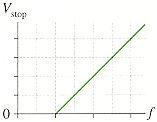
Q- The measurements of a photoelectric-effect experiment are graphed in in Figure, in which the intervals along the horizontal and vertical axes are respectively given by 5.9*1014 Hz and 2.50 V, respectively.
(a) What is the work function of the cathode?
(b) What experimental value of Planck's constant is obtained from these data?
Comments